Best Practice
Specify marker genes
In SDePER, we provide the -m or --marker option for user to specify manually selected cell type-specific marker genes instead of identifying marker genes by Differential analysis on reference scRNA-seq data. The required CSV file for this option is a matrix with rows as cell types and columns as selected marker genes.
The usage of user-specified marker genes differs depending on whether Conditional Variational Autoencoder (CVAE) is enabled to remove the platform effect or not.
In case of enabling CVAE in SDePER:
When CVAE is enabled in SDePER, the union of the top highly variable genes identified from the reference scRNA-seq data and user-specified cell type marker genes are used in CVAE building. So only the gene symbols of this input is used in this situation, and user can provide a matrix with all 0s for this options.
In case of disabling CVAE in SDePER:
When CVAE is disabled in SDePER, the whole cell type-specific gene expression porfile provided by this input is directly used for fitting graph Laplacian regularized model (GLRM). In this situation the input matrix is required to be the average expression profiles across cells from the given cell type which can be calculated from the reference scRNA-seq data. It is recommend to take average on library size normalized gene expression without log transformation.
Reproducibility
The only randomness in SDePER comes from training CVAE, which is essentially a neural network. Using the same value for number of CPU cores (-n or --n_cores) and random seed (--seed) across different runnings in the same hardware can assure you get the same trained model, then get exactly the same cell type deconvolution and imputation results.
Warning
Technologically there is no way to assure reproducibility across different hardware. This is because the hardware/floating point limitation. The floating point standard specifies only how close from the real value the result should be. But the hardware can return any value that is that close. So the residual accumulates during CVAE training process, ultimately resulting in different trained models.
Spot size in ST techonology
The diameter of spot and distance between centers of two neighboring spots are different across different spatial transcriptomic (ST) techonologies. It is recommended to set these 3 SDePER options (--pseudo_spot_min_cell, --pseudo_spot_max_cell and --diameter) based on the ST techonology which is used to generate the spatial data. We provide a summary of spot size in different ST techonologies as below:
Spatial Transcriptomics v1.0
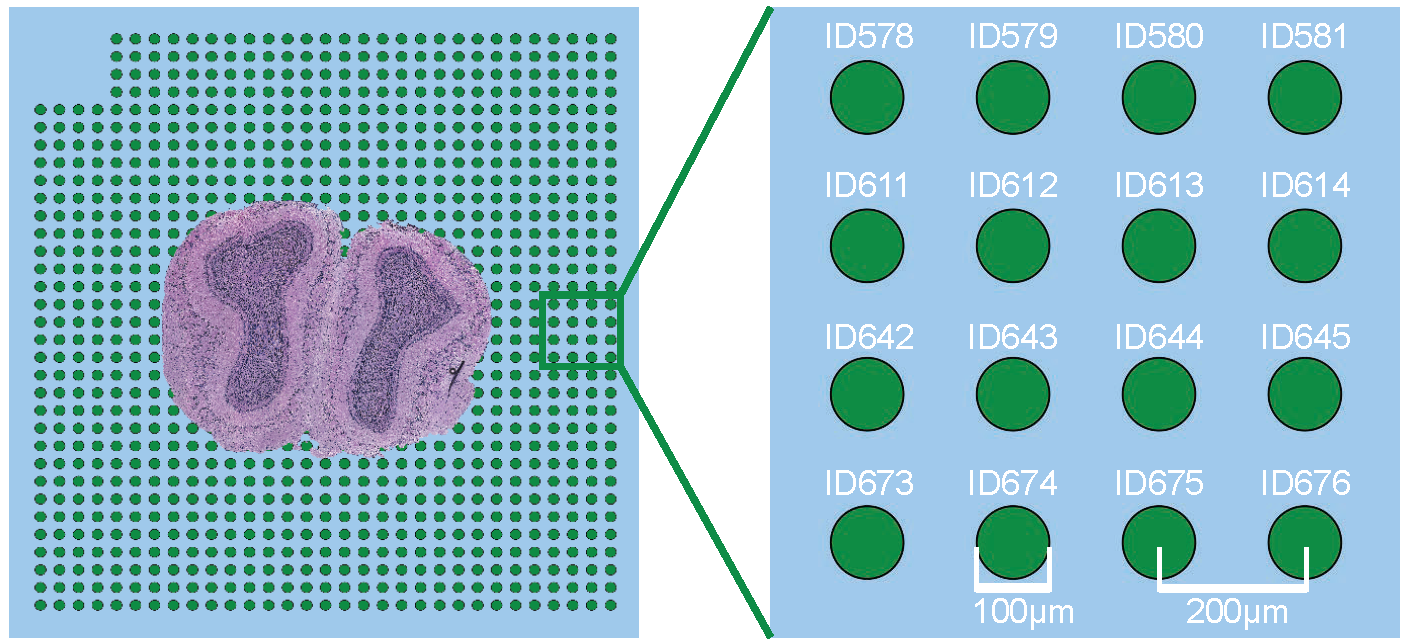
The diameter of each spot is 100 µm and the spot center to center distance is 200 µm. Copied from Figure S2 in Visualization and analysis of gene expression in tissue sections by spatial transcriptomics. 2016, Science.
10x Genomics Visium

The diameter of each spot is 55 µm and the spot center to center distance is 100 µm. Copied from Figure 1 in Inside Visium spatial capture technology.